
Graphical Method for Linear Equations: A Simple Guide for Class 10
In Class 10 Mathematics, you learn that a pair of linear equations in two variables can be solved using different methods. One of the most visual and intuitive ways is the graphical method. Instead of just working with numbers, this method lets you see the solution directly on a graph. It turns abstract equations into straight lines, making it easier to understand how two equations relate to each other .
Key points to remember:
The graphical method solves two linear equations by plotting them on the same graph.
It is part of the NCERT Class 10 chapter “Pair of Linear Equations in Two Variables” .
The solution is the point where the two lines meet on the coordinate plane.
A Linear Equation is a Straight Path on a Graph
Before plotting, it helps to know what you are drawing. A linear equation in two variables, like ax+by+c=0ax+by+c=0, always forms a straight line on a graph . When you have a pair of such equations, you are essentially drawing two straight lines and observing how they behave together.
A linear equation always creates a straight line on the Cartesian plane.
Each point on the line is a solution that satisfies that equation.
The pair of equations represents two lines that may meet, stay apart, or overlap.
The Step-by-Step Process of Plotting the Lines
Solving a pair of equations graphically involves a few clear steps. You do not need to rearrange the equations into any special form; just find two or three points for each equation, plot them, and draw the line .
Find points for the first equation: Choose simple values for xx (like 0, 1, or 2) and calculate the corresponding yy values. This gives you coordinate pairs.
Find points for the second equation: Do the same for the second equation to get another set of coordinate pairs.
Plot and draw: Mark all the points on graph paper and draw a straight line through each set.
Locate the intersection: Look at the point where the two lines cross. The coordinates of this point are your solution.
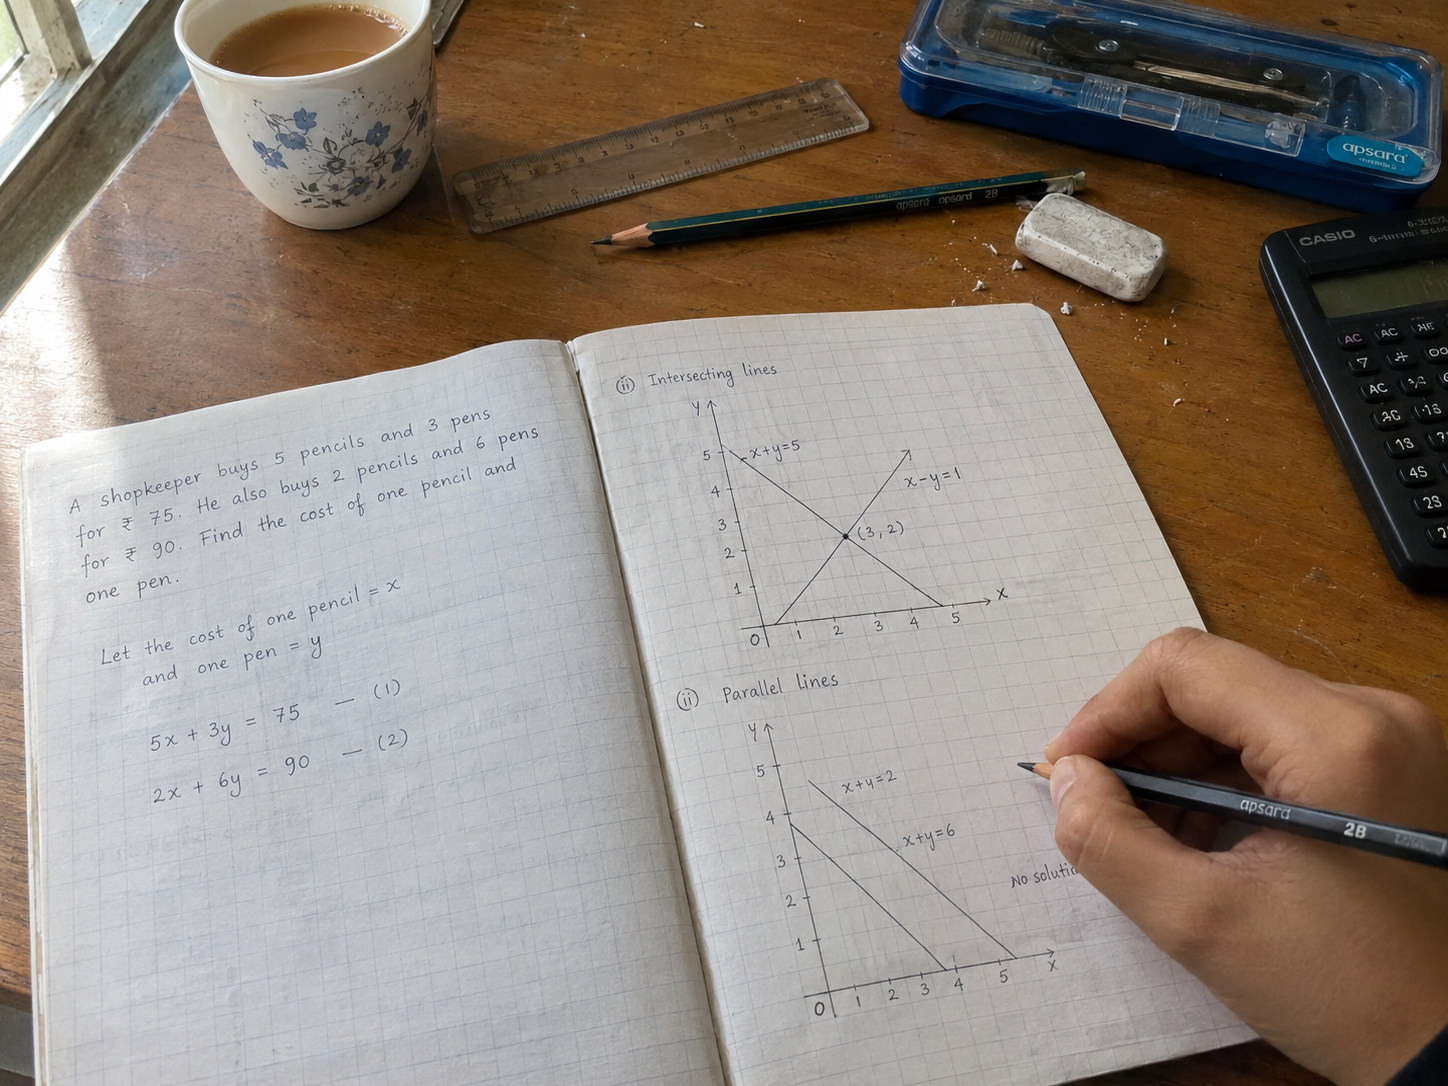
Example in action: For the equations x+y=5x+y=5 and x−y=1x−y=1, plotting the points shows that the lines meet at (3, 2). This means x=3x=3 and y=2y=2 is the common solution .
You only need two points to draw a line, but plotting a third point helps check for mistakes.
The intersection point satisfies both equations at the same time.
The solution is always written as an ordered pair (x,y)(x,y).
Three Possibilities When Two Lines Meet on a Graph
The graphical method reveals three distinct situations. The number of solutions depends entirely on how the two lines are positioned relative to each other .
When the Lines Intersect at a Single Point
If the two lines cross each other at exactly one point, the pair of equations has a unique solution. This happens when the lines have different slopes. The system is called consistent because a solution exists .
The lines meet at one distinct point.
There is only one (x,y)(x,y) pair that works for both equations.
This is the most common case in textbook problems.
When the Lines are Parallel and Never Meet
If the two lines are parallel, they will never cross. In this case, the pair of equations has no solution. The system is called inconsistent. Parallel lines have the same slope but different intercepts .
The lines maintain the same distance apart forever.
There is no common point, so no common solution.
This shows that the equations contradict each other.
When the Lines Coincide and Overlap Completely
If the two equations represent the same line, the graphs will lie exactly on top of each other. This means every point on the line is a solution, leading to infinitely many solutions. The system is consistent and dependent .
Both equations describe the same straight line.
Every point on the line satisfies both equations.
You cannot find a single unique pair of (x,y)(x,y).
Reading the Graph is a Skill for Real-Life Situations
The graphical method is not just for exams; it helps you understand how two changing quantities relate in real life. Word problems about costs, distances, or quantities can be turned into equations and solved by looking at their graphs .
For instance, if one equation represents the cost of pencils and pens, and the other represents a different combination, the intersection point tells you the price of one pencil and one pen that works for both situations .
Graphs make abstract equations easier to interpret visually.
Real-world problems involving two unknowns can be modelled and solved graphically.
The intersection point gives a practical answer to the problem.
A Few Useful Habits for Accurate Graphs
The graphical method is simple, but accuracy matters. A small plotting error can change the apparent intersection point. Developing good habits makes the process smooth and reliable.
Always use a sharp pencil and a ruler for straight lines.
Label the xx-axis and yy-axis clearly on your graph paper.
Choose simple values (like 0, 1, 2) to make calculations easier.
Double-check your points before drawing the final lines.
The graphical method gives you a clear picture of how two linear equations behave together. By plotting both lines, you can instantly see whether there is one solution, no solution, or infinitely many solutions. For Class 10 students, mastering this visual approach builds a strong foundation for understanding more advanced algebra later on.
What is the graphical method for linear equations?
The graphical method solves two linear equations by drawing their lines on the same graph. The point where the lines meet gives the common solution.
How do I plot a linear equation on a graph?
Choose simple values for x and find the matching y values. Plot these points on graph paper and draw a straight line through them.
How many solutions can a pair of linear equations have?
A pair of linear equations can have one solution, no solution, or infinitely many solutions. This depends on whether the lines intersect, are parallel, or overlap.
What does it mean if the two lines intersect at one point?
If the lines cross at one point, the pair of equations has a unique solution. That point satisfies both equations at the same time.
Do I need graph paper for the graphical method?
Graph paper helps you plot points neatly and draw accurate lines. A ruler and a sharp pencil also help you locate the intersection point clearly.

Gurpal Singh
Gurpal Singh, founder - Lumens Academy.
B.E.( Mechanical Engineering )
Teaching experience : 15 years
Subjects : Maths